The New York Energy Grid, by the Numbers: A Power Trends Primer
We've recently launched Power Trends 2019: Reliability and a Greener Grid. Inside this annual report, readers will find the key facts and analysis necessary to understand the many factors shaping our complex electrical system.
The report provides relevant data and unbiased analysis to educate policymakers, stakeholders and market participants, which is especially critical as public policy initiatives accelerate change.
Power Trends contains many important facts. Here are a few high-level metrics, as well as an explanation of their relevance to the grid:
State of the Grid
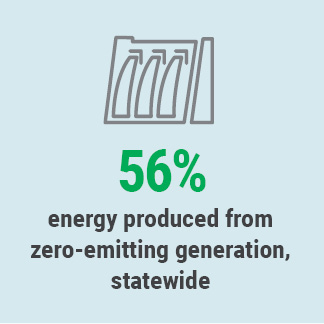
161,114 Gigawatt-hours of total energy use: That’s how much energy was consumed in New York State in 2018. Power came from a diverse fuel mix, including natural gas-powered generators, hydropower, nuclear plants and wind.
33,956 Megawatts: The record for energy consumption in New York, known as “peak demand.” An important metric for grid planning, the New York peak demand record occurred on a hot evening in July 2013 and has not been broken since. One reason we haven't surpassed the record is the increase in energy efficiency investment and the installation of behind-the-meter resources and distributed sources of energy, such as rooftop solar, combined heat and power systems, energy storage devices and other technology. This technology helps to reduce grid demand by providing extra power close to where it’s being used.
11,173 circuit-miles of transmission: We don’t own or maintain the many miles of transmission wires that make up the grid. Our job is to manage the flow of power over these lines in real time. We balance output from suppliers with demand, and identify and respond to issues that may impact reliability.
700+ power generating units: The generating units are dispatched by our operators, who monitor the energy grid 24/7/365, and continually direct suppliers to adjust production to meet demand. At all times, supply must match consumption in order for the grid to function properly.
Clean Energy
1,985 MW: That’s the “nameplate capacity” (the largest amount of generation possible from these sites) of all grid-scale wind in New York, as of 2018. An additional 4,313 MW of wind is proposed for upstate New York, with another 12,908 MW proposed for offshore Long Island.
56%: That’s the total energy produced for the grid from zero-emitting generation, including nuclear power.
26%: That’s how much of New York’s yearly energy came from renewable resources in 2018. While hydropower still makes up a majority of this energy, the number of solar and wind projects are increasing.
The Power of Markets
$5.3 Billion: The value of all transactions in our wholesale energy markets in 2018.
51%, 89%, 98%: the percentage of carbon dioxide, nitrogen oxide, and sulfur dioxide, respectively, reduced from grid-related generation since 1999. Price signals from competitive energy markets have helped to reduce emissions and make the grid greener.

Our annual Power Trends report contains information about these and many other figures that, together, help tell the story of New York’s electrical grid. Visit the Power Trends 2019: Reliability and a Greener Grid web page.